Background
CDNs and cloud providers deliver large volumes of traffic on the Internet and employ extensive monitoring tools to ensure performance and reliability. These include tools that cover various layers of traffic delivery such as Network, Server, Application, etc. TCP/IP accounts for the majority of this traffic (while UDP-based QUIC is on the rise globally, it is still a small fraction of total traffic compared to TCP).
Sockets are operating system abstractions that link the client and server connection over which the data is transmitted. Network issues, therefore, are directly reflected in the data stored with each socket. For example, congestion in the network can lead to slow response times and an increase in Round Trip Times (RTT). It is also possible that network bandwidth is available but the application is overwhelmed with too many requests and cannot fill up the buffer with enough data to fully utilize the available bandwidth, resulting in an application-limited anomaly. Often servers handle multiple sockets at the same time which can lead to resource contention putting stress on system resources like CPU and memory.
Thus monitoring the performance of TCP sockets at scale can provide a critical understanding of traffic behaviors, such as slow response times or dropped connections, and identify cases where improvements can be made.
Existing tools
The “ss” utility in Linux is a common tool used to get socket statistics. Similar to “netstat”, ss provides a faster and more flexible mechanism to get information by allowing filters on socket states, protocols, and addresses. We started our socket monitoring journey with ss as well. While it’s a powerful tool to quickly get a list of sockets and relevant metrics, the main challenge of ss is that it can consume significant resources, especially when used on systems with a large number of sockets. This can impact system performance and slow down other processes. Moreover, ss output is not ideal for parsing, due to inconsistent key: value usage, and significantly complicates the ability to stream collected data from thousands of servers.
Our first version of socket collection using ss was a bash script running on selected cache servers which we export the output of “ss –tcp –info” to a file. This file would then be rsync-ed to a bastion host from which a python script would read it, parse and insert it into ElasticSearch. This got the job done but was nowhere near the scale we needed. The next iteration of this work was to have a python script live on the cache servers which would be called from an HTTP interface and return the aggregated stats back to be inserted into the ElasticSearch cluster. This method scaled the parsing bottleneck from a central back-office location to the individual cache server but resulted in large memory utilization on servers with a significantly high number of sockets. Ultimately, we recognized the need for a lightweight replacement for the ss portion of the system.
Our key requirements for this new tool were that it should be lightweight and scale to the large number of sockets our CDN servers have and be able to stream data back using an efficient mechanism such as protocol buffers. TCP-info tool from the MeasurementLab is a great utility implemented in Golang. However, it is designed for tracking the same sockets over time. Given the large volume of our socket connections, we made a design choice to not track individual sockets. Instead, have each polling loop be independent, providing a snapshot of the current state of open sockets. The primary goal here is to track the overall performance of the system and not individual sockets.
xTCP
To solve these challenges, we introduce and open-source xTCP (eXtract, eXport, Xray TCP). xTCP is a Golang utility to capture and stream socket data at scale. xTCP uses Netlink to capture socket information, packages the data in protobufs, and sends it out via a UDP port (to be eventually sent to Kafka, etc) or write to NSQ.
Netlink provides a generic interface for communication between user space and kernel space. Socket monitoring tools ss, tcp-info use NETLINK_INET_DIAG, part of the Netlink protocol family, for getting socket information from kernel into the user space (note from man page: NETLINK_INET_DIAG was introduced in Linux 2.6.14 and supported AF_INET and AF_INET6 sockets only. In Linux 3.3, it was renamed to NETLINK_SOCK_DIAG and extended to support AF_UNIX sockets.)
xTCP extracts kernel TCP INET_DIAG data at high rates and exports that data via protobufs. On a machine with approximately ~120k sockets, the Netlink messages are about ~5-6MB, however, the ASCII output of ss is about ~60MB. Moreover, ss reads from the kernel in ~3KB chunks by default. xTCP reads 32KB chunks and thus minimizes system calls. xTCP reads Netlink socket data concurrently using multiple workers to drain the queue as fast as possible and concurrently parses the Netlink messages for streaming. All of these optimizations make xTCP’s footprint smaller to run on production cache servers.
Usage at Edgio
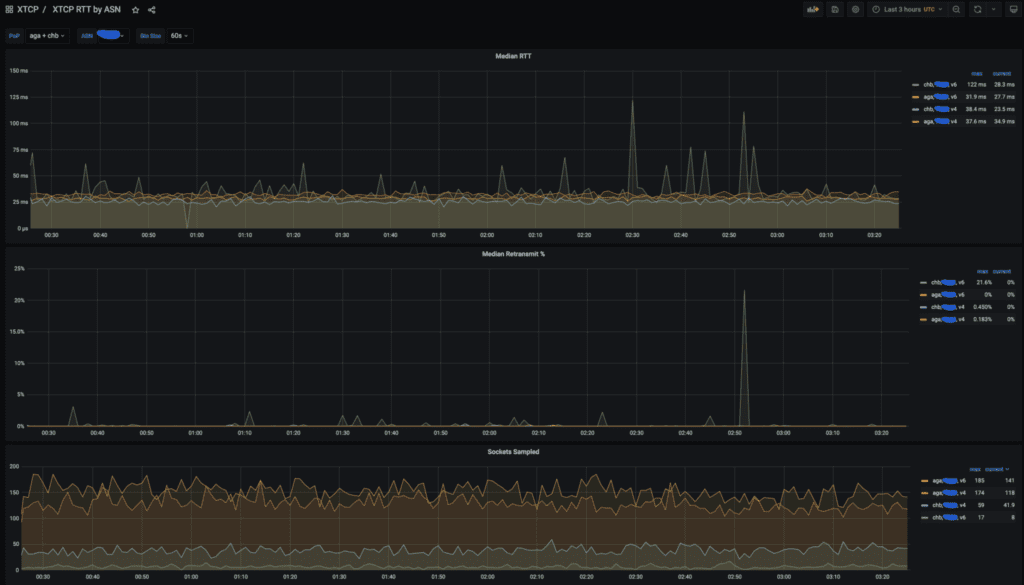
We utilize xTCP data heavily to analyze client performance. Commonly we track RTT and Retransmits aggregated by Point of Presence (PoP) and ASN.

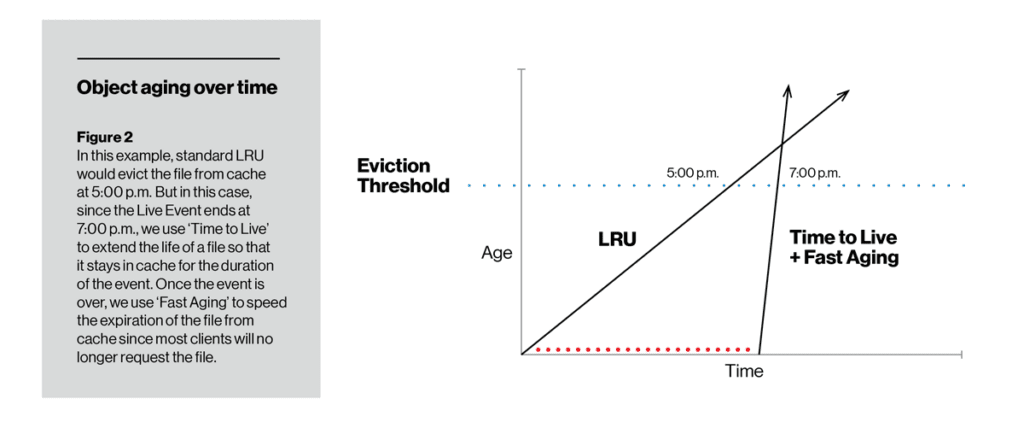
In contrast to Aging Rate, TTL lets us change the cache-ability of a particular item. For the duration set using the TTL function, an item does not age while it’s on the disk, so it is less likely (even very unlikely) to get evicted. After the TTL expires, the item can begin to age either in the traditional LRU manner or with fast aging or slow aging (depending on how the operator configures it). In the figure below, TTL with slow aging kept an item on disk to the point where it didn’t exceed the cache eviction threshold. At the opposite end, TTL ensured that a live video stream was cached for at least the duration of the event, but after that was quickly removed from the disk using fast aging.

An example xTCP dashboard showing RTT, Retransmits, and number of Sockets sampled for PoPs AGA and CHB for a large US provider.
In a previous blog post, we presented our pipeline for dynamic congestion control tuning to automatically enable BBR for clients that are underperforming and where we know BBR’s mechanism would be most useful. xTCP data is the main source for the analysis.
We are constantly finding new ways to use the xTCP data to answer complex questions such as the impact of congestion, and machine learning for predicting performance and detecting anomalies. We plan to report on such analysis of socket data in a future blog post.
Today xTCP joins vFlow (sflow, netflow, ipfix collector) in our suite of open-source network monitoring tools. We hope this serves the infrastructure performance monitoring community for socket data collection and are looking forward to active participation in taking this tool further.
Acknowledgment
xTCP’s success and wide usability are a result of contributions from individuals and teams across Edgio. We would like to especially thank David Seddon who is the initial developer of xTCP. Special thanks to all the internal code reviewers and contributors for testing, ingesting, dashboards, and feedback on xTCP.
 GigaOM Radar Edge Platform Leader & Outperformer 2024 |


